SEO
What Are Core Web Vitals? Practical Ways to Improve LCP, INP and CLS
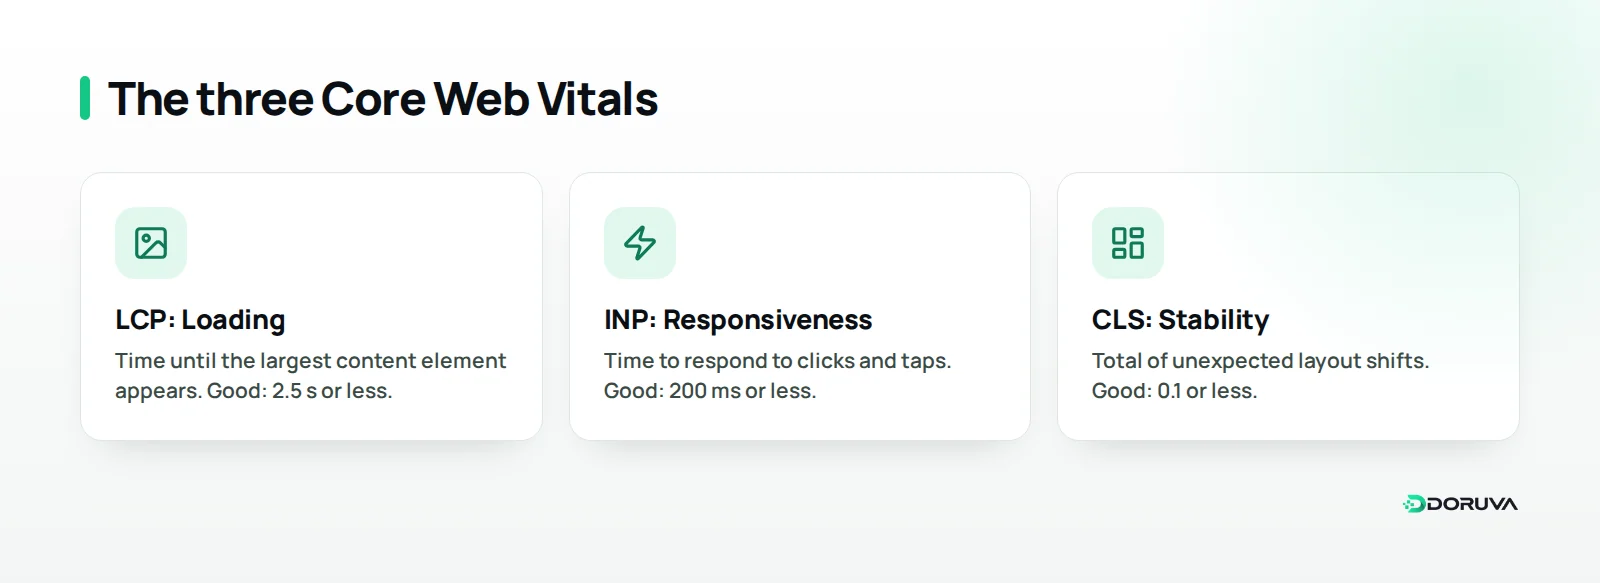
Core Web Vitals are three metrics: LCP for loading speed, INP for responsiveness and CLS for visual stability. This guide covers the thresholds, how to measure them properly and the fixes that make a real difference for each metric.
By Mehmet ÇalışırPublished 9 min read
Contents
This guide is for site owners, marketers and developers who have stared at a PageSpeed Insights report without knowing where to begin. We cover what each metric measures, how to measure it properly and which fixes actually move the needle. For the bigger picture, see our 25-point technical SEO checklist; this article goes deeper into its performance section.
What are Core Web Vitals, and why do they matter?
Core Web Vitals are a set of three metrics that use real-user data to measure how quickly a page loads, how fast it responds to interactions and how stable it stays while loading. Google uses them as part of the page experience signals its search systems take into account.
It helps to keep expectations realistic. Google's Core Web Vitals documentation is clear that good scores alone do not guarantee top rankings; relevant, helpful content comes first. Speed does, however, decide whether visitors stay. A product page that loads slowly, or a form that freezes when tapped, loses customers regardless of where it ranks.
The set can change over time. In March 2024, INP replaced FID as the responsiveness metric. We recommend checking current definitions and thresholds against the official source on web.dev.
| Metric | What it measures | Good | Needs improvement | Poor |
|---|---|---|---|---|
| LCP | Loading time of the main content | ≤ 2.5 s | 2.5–4 s | > 4 s |
| INP | Responsiveness to interactions | ≤ 200 ms | 200–500 ms | > 500 ms |
| CLS | Unexpected layout shifts | ≤ 0.1 | 0.1–0.25 | > 0.25 |
A page passes only when all three metrics fall within the good range at the 75th percentile of visits. Mobile and desktop are assessed separately, so track both.
What is LCP, and how do you improve it?
LCP (Largest Contentful Paint) measures how long it takes for the largest image or text block in the viewport to appear on screen. On most sites that element is the hero image, a product photo or a large headline.
Break LCP into four parts
Treating LCP as the sum of four consecutive phases, rather than a single number, makes the bottleneck much easier to find:
- Time to first byte (TTFB): how long the server takes to start sending HTML.
- Resource load delay: the gap before the browser discovers the LCP image and starts downloading it.
- Resource load duration: the download itself.
- Element render delay: the time between the download finishing and the element being painted.
On a coffee brand's homepage with a heavy hero image and a fast server, the problem is most likely download time. If the image is small but LCP is still high, the browser is probably discovering it late or waiting on render-blocking files.
Practical LCP fixes
- Never lazy-load the LCP image; mark it with
fetchpriority="high"so the browser prioritises it. - Put the image in the HTML as a real image element rather than a CSS background or something injected later by JavaScript, so it is discovered early.
- Serve it at its displayed size, in a modern format such as WebP or AVIF, with size variants for different screens.
- On the server side, enable caching, compression and a CDN where needed, and remove unnecessary redirects.
- Defer CSS, JavaScript and web fonts the first view does not need.
- If the main content is built only by client-side JavaScript, consider server-side rendering or static generation.
When the LCP element is a headline rather than an image, the web font is often the deciding factor: if text stays invisible until the font arrives, LCP waits too. Preloading the font, dropping unused weights and showing a fallback font in the meantime all help.
What is INP, and how do you improve it?
INP (Interaction to Next Paint) measures the time from a click, tap or key press until the screen visibly updates. It reports one of the slowest interactions observed during a visit, ignoring outliers, so what counts is how responsive the page is overall, not one quick click.
The three phases of an interaction
Every interaction has three parts: input delay, while the browser is busy with something else; processing time, while event handlers run; and presentation delay, while the browser paints the next frame. Most INP problems come from JavaScript that keeps the main thread busy for too long.
Practical INP fixes
- Break up long tasks: any task over 50 milliseconds counts as a long task. Split large jobs into chunks and yield to the main thread in between.
- Keep event handlers lean: do only the visible update straight away after a click, and push non-urgent work such as analytics calls to later.
- Audit third-party scripts: tag managers, ad scripts and chat widgets are often the heaviest load. Remove anything you do not actually use.
- Keep the DOM small: pages with thousands of elements cost more to repaint on every update.
On an online store, a product grid that lags after a filter is applied, or an "add to cart" button that seems to ignore the tap, are classic INP problems. The shopper taps again, two items land in the cart, and trust takes a hit.
To find the slow interaction, start with field data to see which template has a poor INP. Then record a trace in the Chrome DevTools Performance panel on that page and repeat the suspect interaction. The trace shows which script kept the main thread busy after the click, and for how long.
What is CLS, and how do you improve it?
CLS (Cumulative Layout Shift) is a unitless score for the total impact of unexpected movement on a page while it loads and while it is used. Text jumping down as you read, or a button moving just as you tap it, is exactly what CLS captures.
Shifts within 500 milliseconds of a user interaction are excluded, so a menu that opens on click is fine. The problem is movement the user did not ask for.
Practical CLS fixes
- Give images and videos width and height attributes, or set an aspect ratio in CSS.
- Reserve fixed space for ad slots, embeds and components that load later.
- Show cookie notices as an overlay rather than a banner that pushes content down.
- Never insert new elements above existing content without a user interaction.
- Match fallback font metrics to your web font to reduce text jumping when it loads.
- Animate with
transforminstead of position or size properties.
Picture a dental clinic's booking page where a promotional banner is injected above the form after it loads: the fields drop down and the visitor taps the wrong one. Reserving a fixed-height slot for the banner fixes both the CLS score and the booking experience.
Field data or lab data: how should you measure?
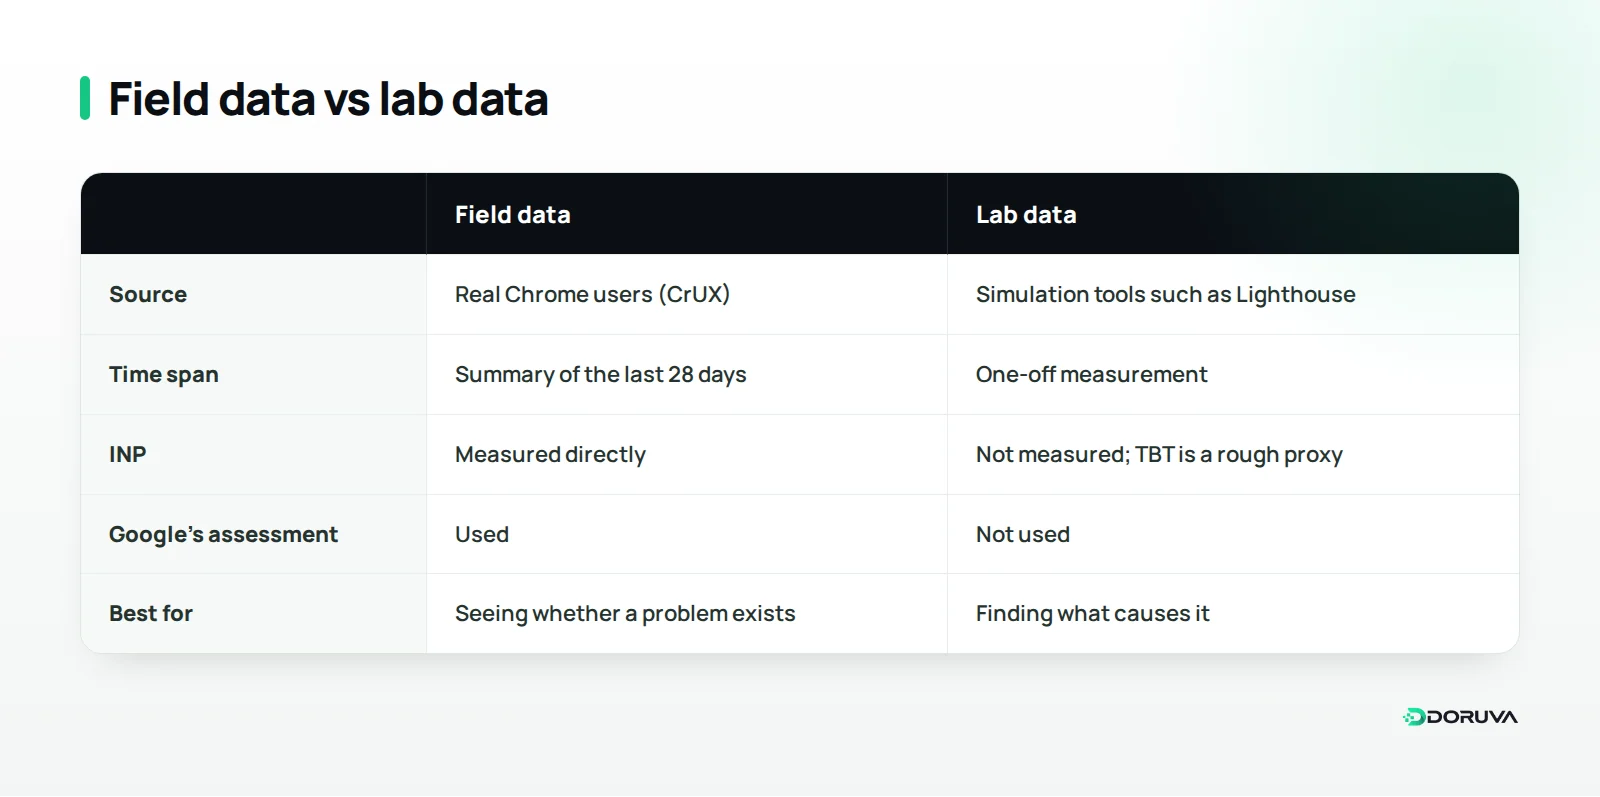
Google assesses pages on field data collected from real users; lab data is what you use to find the cause. Understanding the difference between field data and lab data keeps you from optimising for the wrong target.
Field data comes from the Chrome UX Report (CrUX), collected anonymously from Chrome users and summarised over the last 28 days. Lab data is a one-off measurement from tools like Lighthouse that simulate a given device and connection. Because a lab test does not interact with the page on its own, it cannot measure INP directly; Total Blocking Time (TBT) serves as a rough proxy.
Knowing which tool does what speeds up the work:
- Search Console Core Web Vitals report: groups similar URLs to show which templates are struggling across the site.
- PageSpeed Insights: shows field and lab data for a single URL side by side.
- Chrome DevTools Performance panel: lets you inspect long tasks, layout shifts and the LCP element in detail.
- Your own real-user monitoring: tools such as Google's web-vitals library let you send the metrics to your own analytics.
Low-traffic sites may not have enough CrUX data for field results to appear. In that case, rerun lab tests regularly and set up your own measurement.
In what order should you tackle improvements?
The most efficient approach is to start with the metric that fails in field data, on the page template that gets the most traffic. Fixing a template improves every page built on it, rather than one URL at a time.
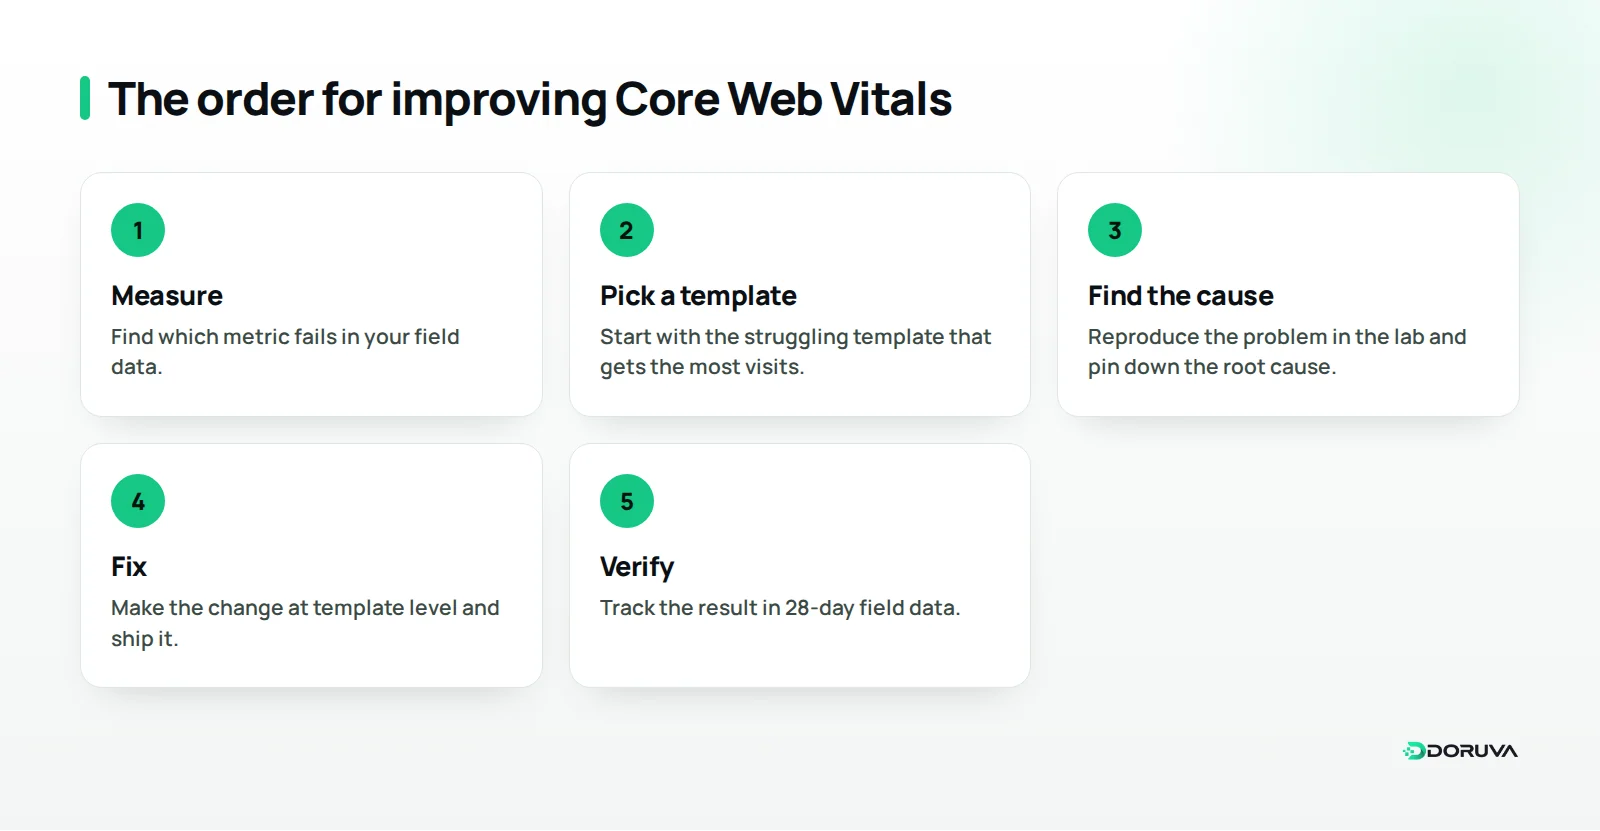
If product pages, not the homepage, take most of an online store's visits, the first job is that template's LCP image and the responsiveness of its cart button. Lab results improve as soon as you ship; field data catches up gradually because of the 28-day window.
The cheapest way to get good performance is to plan for it from the start, since theme, plugin and hosting choices can set limits that are hard to undo later. We look at the decisions that shape a web project's scope and budget in our guide to what drives the cost of a business website.
Common Core Web Vitals mistakes
The most common mistake is treating the lab score as the goal, when the real goal is the experience of actual users. These are other frequent time sinks:
- Measuring only the homepage: most visits often land on category, product or blog pages.
- Looking only at desktop: phones have slower processors and connections, so problems tend to show up there first.
- Chasing a Lighthouse score of 100: if field data is already good, that effort is better spent elsewhere.
- Ignoring third-party scripts: your own code can be lean while the tools you add weigh the page down.
- Relying on a plugin to fix everything: caching and optimisation plugins help, but they cannot remove root causes such as a heavy theme or unnecessary scripts.
- Expecting instant results: field data uses a rolling window, so improvements appear gradually.
Summary and next steps
Core Web Vitals measure loading speed with LCP, responsiveness with INP and visual stability with CLS. Use field data to find the failing metric and template, use the lab to find the cause, fix it at template level and confirm the result in field data.
For a quick read on your site's overall health, try our free SEO checker. If you want performance handled as part of a wider technical SEO effort, take a look at our SEO service; if the theme or platform is the root cause, our web design service builds speed in from the start. To review your measurements together, contact our team.
Frequently Asked Questions
How much do Core Web Vitals affect rankings?
Core Web Vitals are one of Google's page experience signals, but they do not guarantee top positions on their own. Google says relevant, helpful content comes first; speed mostly pays off through visitors staying and converting.
My PageSpeed Insights score is low but Search Console shows no issues. Which should I trust?
Google's assessment is based on field data from real users. The lab score comes from a simulated device and connection, so if your field data is in the good range, other issues may deserve priority.
Is FID still measured?
No. In March 2024, INP replaced FID as the responsiveness metric. Because INP looks at interactions throughout a visit rather than just the first one, it reflects overall responsiveness much better.
How long until the reports reflect my fixes?
Lab tests show improvements immediately. Field data summarises the last 28 days, so Search Console and PageSpeed Insights reflect the change gradually.
What should I do if my small site has no field data?
Low-traffic sites may not have enough Chrome UX Report data. Run lab tests regularly and set up your own real-user monitoring with a library such as web-vitals.