

What is Field Data and Lab Data?
Definition
Field data is performance data measured in real users' browsers, on their own devices and network connections. Lab data is produced by testing a page in a controlled environment with one predefined device, network and location profile. Field data shows what visitors actually experience; lab data reproduces problems consistently so they can be diagnosed and fixes can be verified before release.
Also known as: lab data, real-world data, field metrics, lab metrics, lab vs field data
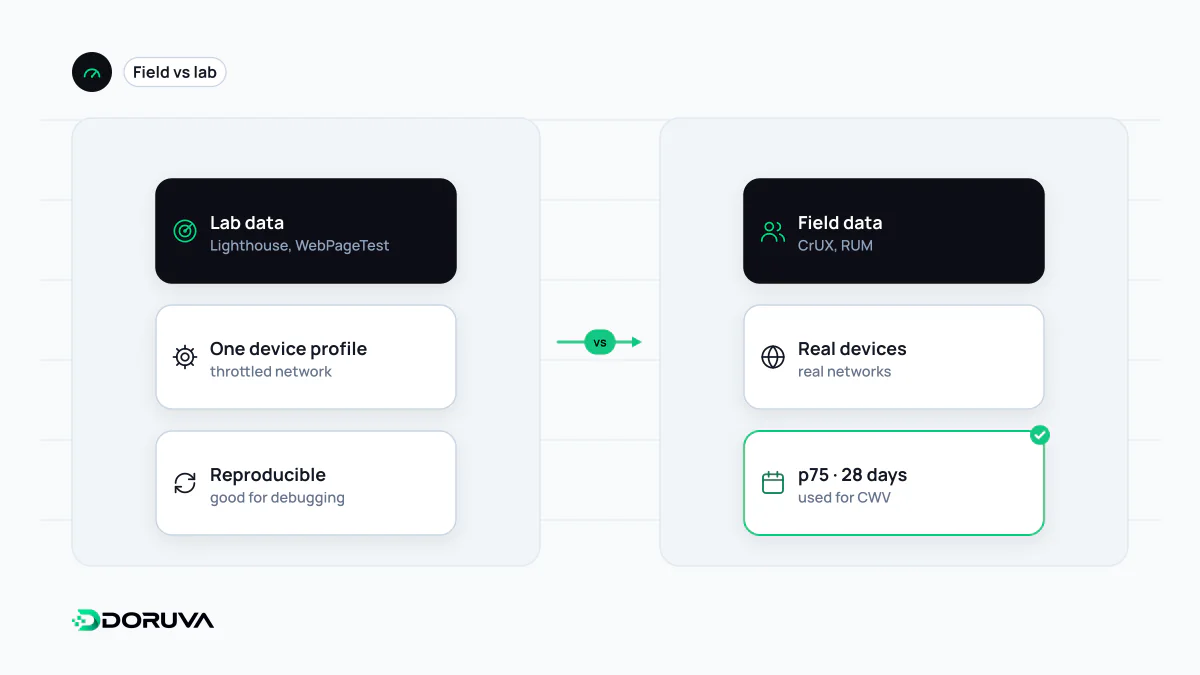
Two ways of measuring
A lab test is an experiment: you fix the variables and get a reproducible number. Field measurement is observation: you collect what thousands of visitors experienced on different phones, networks and times of day. One answers "what happens under these conditions?", the other "what actually happened?".
| Field data | Lab data | |
|---|---|---|
| Source | Real visits (CrUX, your own RUM) | Tools such as Lighthouse, WebPageTest, DevTools |
| Conditions | Each visitor's own device, network and location | One emulated device and network profile |
| Shape of the result | A distribution, usually reported at the 75th percentile | The value from a single run |
| Interaction metrics | INP is measured directly | INP cannot be measured; TBT is the proxy |
| Feedback loop | Days to weeks | Minutes |
| Main job | Establish status and priorities | Find causes, verify fixes |
Why field data is a distribution
Sort the LCP values of a thousand visits from fastest to slowest. The median visit (p50) might load in 1.6 seconds, the 750th (p75) in 2.9 seconds and the 950th (p95) in 6 seconds. Google's Core Web Vitals assessment uses the 75th percentile: it asks that most visits are good without letting a handful of extreme outliers decide the verdict.
Working with distributions has a consequence people often miss: field numbers can get worse without any code change. Launch a campaign that brings in visitors on older Android phones, or start attracting more traffic from far-away countries, and p75 shifts upwards. Interpreting field data without splitting it by device type, country and connection can send you after the wrong problem.
How lab conditions are set up
A lab run rests on deliberate assumptions. The cache is empty, so every test represents a first visit. CPU and network are throttled; Lighthouse mostly simulates the slowdown mathematically, while DevTools applies it for real. The viewport is fixed, there is no cookie banner or personalisation, and nobody interacts with the page. Those assumptions are what make results comparable from one run to the next, and they are also exactly where the lab drifts away from reality.
Why the same page gets different results
- A different LCP element. Screen size, A/B tests, personalised content or a consent dialog can make a different element the largest one for real users.
- Warm caches. Returning visitors already have files stored, so field LCP is often better than the lab suggests.
- Instant navigations. Pages restored from the back/forward cache or prerendered in advance appear almost instantly; the lab never sees these.
- How long CLS is measured. The lab only captures shifts during load. In the field CLS covers the page's whole lifetime, so an ad slot without reserved space that loads as the user scrolls drives field CLS up.
- Interactions. Nobody clicks in the lab. INP problems surface only in the field.
web.dev keeps a thorough write-up of these lab and field differences.
A workflow that uses both
- Locate the problem with field data. Which metric, which page template, which device group is poor?
- Reproduce it in the lab. Recreate similar conditions (mobile profile, slower CPU) and find the cause with Lighthouse or DevTools.
- Verify the fix in the lab. Compare the same test before and after release; synthetic monitoring can run those checks on a schedule.
- Confirm it in the field. CrUX uses a 28-day window, so improvements appear slowly. Your own real user monitoring gives a much faster signal.