

What is TBT (Total Blocking Time)?
Definition
TBT (Total Blocking Time) is a lab metric that adds up how long the main thread was blocked enough to prevent input responsiveness after First Contentful Paint. For every long task over 50 milliseconds, only the portion beyond 50 ms counts. Because it needs no real user, it serves as the lab proxy for Interaction to Next Paint (INP), which can only be measured in the field.
Also known as: Total Blocking Time, main thread blocking time
The 50 millisecond rule
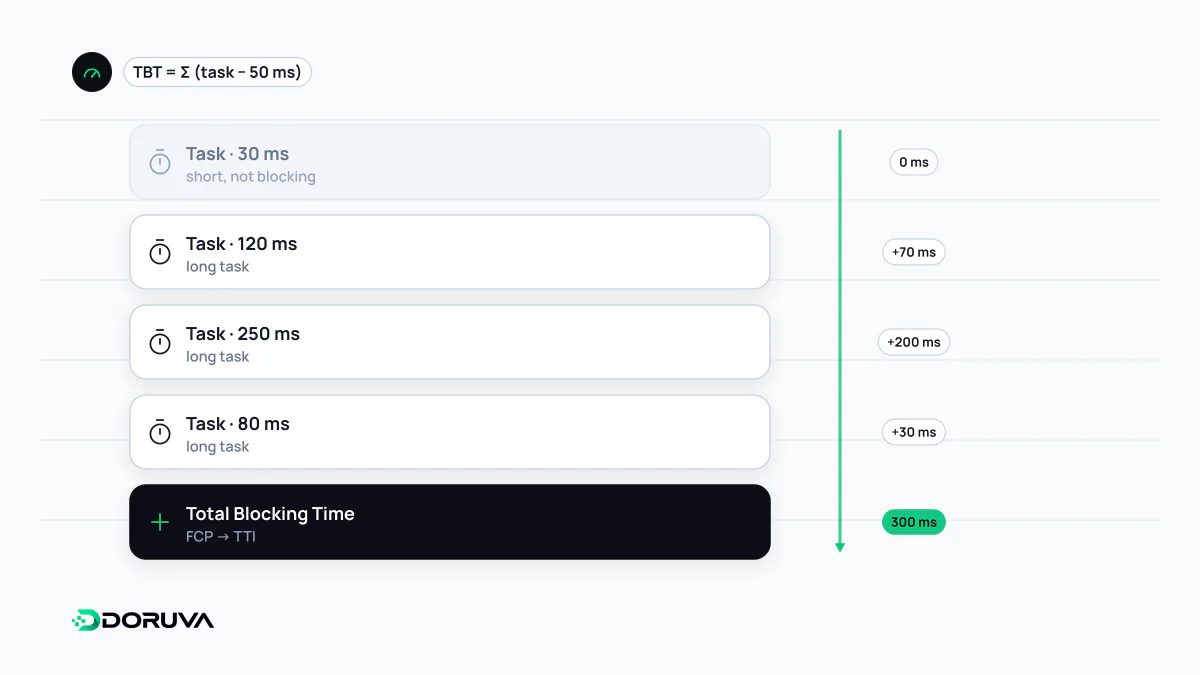
While the browser's main thread runs JavaScript, calculates styles or lays out the page, it cannot react to a tap or keypress. Any task longer than 50 ms is a long task, and the part beyond those first 50 ms is its blocking time. TBT is the sum of the blocking time of every long task between First Contentful Paint and Time to Interactive.
| Task duration | Blocking portion |
|---|---|
| 250 ms | 200 ms |
| 90 ms | 40 ms |
| 35 ms | 0 ms |
| 30 ms | 0 ms |
| 155 ms | 105 ms |
| Total | TBT = 345 ms |
The main thread was busy for 560 ms in total, yet TBT is 345 ms: short tasks leave gaps where input can be handled, so they are not penalised. The practical consequence is that splitting the same amount of work into small chunks lowers TBT even if total CPU time stays the same.
A lab metric by design
TBT is measured in a controlled run, independent of when anyone clicks. In the field, real users interact at unpredictable moments, which would make the number too noisy to compare. Real responsiveness is captured instead by INP, the Core Web Vital. The two tend to move together, but they are not interchangeable. TBT only covers the loading phase; a sluggish filter panel that freezes the page three seconds after load never shows up in TBT, while INP will catch it.
Weight and thresholds in Lighthouse
At 30%, TBT is the heaviest single metric in the Lighthouse performance score, which is why script-heavy pages often score poorly even when they look fast.
| Device | Fast (green) | Moderate (orange) | Slow (red) |
|---|---|---|---|
| Mobile | 0–200 ms | 200–600 ms | > 600 ms |
| Desktop | 0–150 ms | 150–350 ms | > 350 ms |
web.dev recommends staying under 200 ms when testing on average mobile hardware. Lab runs throttle the CPU on purpose: a page that feels instant on a developer laptop can produce several hundred milliseconds of TBT under mobile emulation.
Ways to reduce it
- Ship less JavaScript. Use code splitting so each route loads only what it needs, and tree shaking to drop dead code.
- Break up long tasks. Process large loops in chunks and yield back to the main thread between them.
- Trim hydration. Hydrating an entire server-rendered UI at once can create one huge task; keeping non-interactive parts out of the client bundle shrinks the cost of hydration.
- Delay third parties. Load chat widgets, ad and tag scripts with
deferor after the first interaction.
To find the culprit, record a load in the Performance panel of Chrome DevTools and look for tasks flagged with a red corner; the bottom-up view shows which script spent the time.