

What is RUM (Real User Monitoring)?
Definition
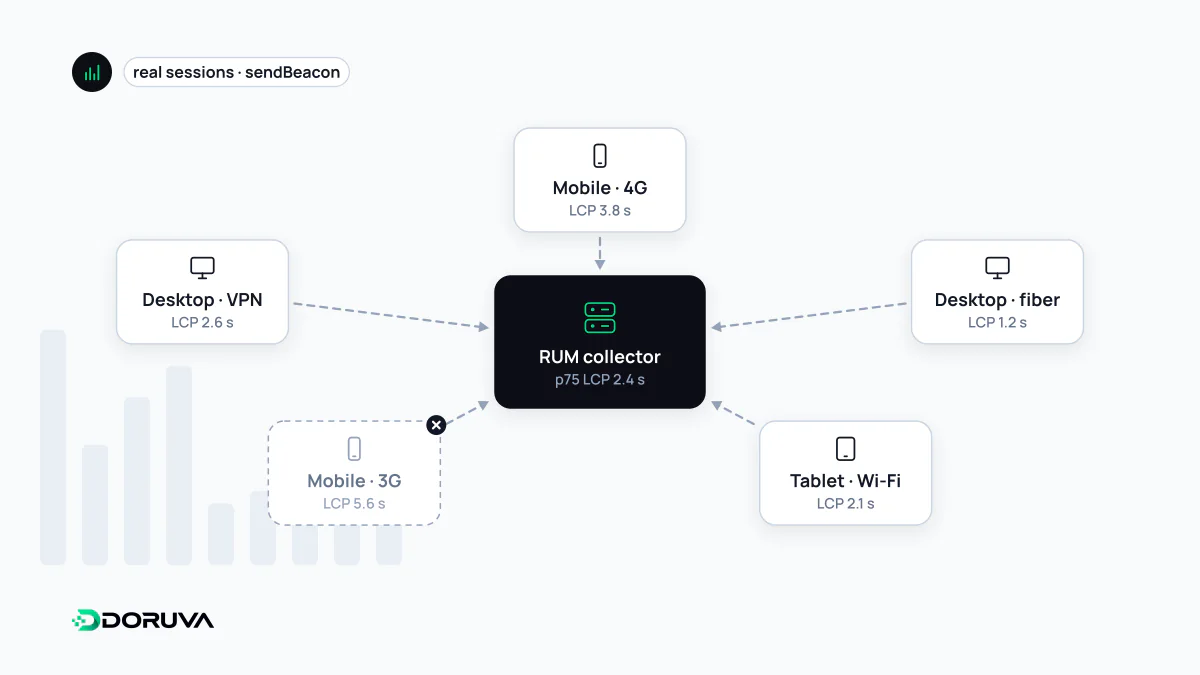
Real user monitoring (RUM) is the practice of measuring a site's performance with a small script that runs in visitors' browsers and sends the results to a collection endpoint. Data such as Core Web Vitals, load timings and JavaScript errors is captured for each visit, then analysed by dimensions like page, device, country or release. Unlike CrUX, the data belongs to you and can cover every browser.
Also known as: Real User Monitoring, RUM, end-user monitoring, real user measurement, web-vitals library
Field data you own
CrUX is public and free, but limited: it covers only eligible Chrome users, includes only public and sufficiently popular pages, and arrives as delayed 28-day aggregates. RUM is measurement you set up yourself. Logged-in dashboard pages, a noindexed checkout step or a template you released yesterday all get measured, and you can slice the data any way you like within minutes.
| CrUX | Your own RUM | |
|---|---|---|
| Browsers | Eligible Chrome users only | Any browser supporting the measurement APIs |
| Pages | Public, popular pages | Every page that loads the script |
| Latency | Days, 28-day window | Minutes |
| Extra dimensions | Form factor, country | Template, release, A/B variant, signed-in state and more |
| Diagnostics | None | LCP element, target of a slow interaction, etc. |
Measuring in the browser
Browsers expose performance data through APIs such as Navigation Timing, Resource Timing and Event Timing, observed with PerformanceObserver. Computing Core Web Vitals correctly from these primitives is harder than it looks, with details like CLS session windows and how INP picks the interaction. That is why Google's open-source web-vitals library is the usual starting point:
import { onLCP, onINP, onCLS } from 'web-vitals';

function report(metric) {
  const body = JSON.stringify({
    name: metric.name,      // "LCP", "INP", "CLS"
    value: metric.value,
    rating: metric.rating,  // "good" | "needs-improvement" | "poor"
    id: metric.id,
    page: location.pathname
  });
  // sendBeacon keeps working while the page is being unloaded
  navigator.sendBeacon('/rum', body);
}

onLCP(report);
onINP(report);
onCLS(report);
The library's attribution build (web-vitals/attribution) adds diagnostic detail to every metric: a selector for the LCP element, the element that shifted, the element a slow interaction targeted. That detail is what turns a number into a fix. Bear in mind that not every metric is available in every browser; browsers without support simply never report that metric.
Making the data useful
- Use percentiles, not averages. Performance data is heavily skewed; p75 and p95 tell you far more than the mean.
- Attach dimensions. Page template, device type, country, connection type and release version make it quick to see where a regression came from.
- Sample. On high-traffic sites storing every visit is wasted money; a random percentage is statistically sufficient.
- Alert on regressions. If p75 INP jumps after a deploy, the team should know within hours, not weeks later from CrUX.
Build, borrow or buy
There are three common routes. You can write your own collection endpoint and store beacons in your own database, which is flexible but leaves querying and charting to you. You can send the metrics as events to your web analytics tool, which is quick to set up, although analytics products are not designed for distribution analysis. Or you can use a commercial RUM or APM product with ready-made dashboards and error tracking. Whichever you choose, treat RUM as one part of your observability setup, alongside server logs and tracing.
Privacy and weight
The RUM script itself costs something, so keep it to a few kilobytes and make sure it never delays the main content. Watch what you send: query strings can carry email addresses or order numbers. Performance measurement rarely needs an identifier for the user at all. If you do use cookies or persistent IDs, cookie consent requirements may apply, and that is a question for a proper legal assessment.