

What is Observability?
Definition
Observability is the ability to understand what is happening inside a system from the telemetry it emits, mainly logs, metrics and traces, including questions nobody anticipated in advance. Monitoring watches known failure modes with thresholds and alerts; observability aims to answer new questions such as “why is this request slow?” from existing data, without writing and shipping new code first.
Also known as: o11y, monitoring, APM, application performance monitoring, telemetry, metrics
Beyond dashboards of known failures
Monitoring is built around questions you already know to ask: is CPU above 90%, is the disk filling up, is the error rate over 1%? Those checks matter, but they only catch failures someone predicted. In modern systems many incidents are new combinations: requests from one mobile app version, using one payment method, slow on only one database replica.
Observability is being able to answer that kind of question from data the system already produces, without adding instrumentation and redeploying first. That requires telemetry rich in context (version, customer segment, endpoint, region) and tools that let you slice by it. Monitoring does not go away; it becomes the alerting layer on top.
Logs, metrics and traces
| Signal | Question it answers | Example | Watch out for |
|---|---|---|---|
| Logs | What exactly happened? | Payment provider returned “card declined” for order 1042 | Volume and cost grow fast; sensitive data can leak |
| Metrics | How much, how often, which trend? | Requests per minute, p95 response time, queue depth | Cheap and fast, but aggregated |
| Traces | Where did the time go, which hop failed? | The steps of one checkout across five services | Usually sampled, not every request |
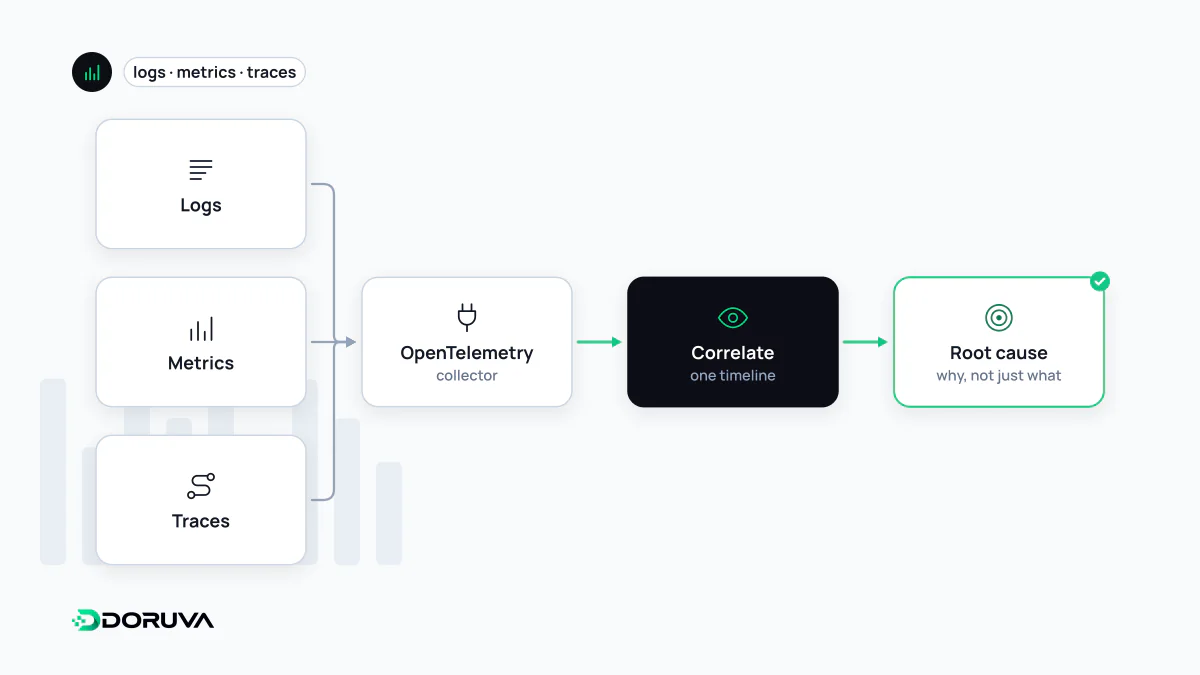
Logging gives you detail about individual events, metrics give you overall health, and distributed tracing shows a request's path across services. The real power comes from linking them: from the metric that fired an alert to example traces, and from a trace to the logs of that exact request. The open standard OpenTelemetry defines traces, metrics and logs as stable signals and lets you collect them in a vendor-neutral way.
Choosing what to measure
Measuring everything can leave you seeing nothing. The four golden signals from Google's SRE practice are a solid starting point for any user-facing service:
- Latency: how long requests take, tracked as percentiles (p50, p95, p99) rather than averages, and separately for successful and failed requests. See latency for why the tail matters.
- Traffic: requests or transactions per second.
- Errors: the rate of failed requests, including “200 OK with the wrong content”, not only 5xx responses.
- Saturation: how full the system is: CPU, memory, connection pools, queue depth.
Server-side numbers do not fully show what users experience. Browser data from real user monitoring (RUM) and scripted checks that exercise critical flows on a schedule close that gap.
Alert on symptoms, not causes
Attaching an alert to every metric quickly produces a stream of notifications nobody reads. Alert on what users feel instead: not “CPU is high on one host” but “checkout error rate has exceeded its target for ten minutes”. Targets are usually written as service level objectives (SLOs), for example “99.5% of requests answered in under 300 ms”. Reserve paging for situations where users are affected and someone needs to act now; everything else can wait for a ticket or a dashboard.
APM tools and what drives cost
APM (application performance monitoring) products, commercial or open source, use an agent or SDK inside the application to capture request timings, database queries and errors automatically. Instrumenting with OpenTelemetry keeps you free to switch backends later. Two factors dominate the bill: log volume and metric cardinality. Adding a label with millions of distinct values, such as a user ID, to a metric explodes the number of time series; that level of detail belongs in logs or traces. A release label is the opposite case, cheap and extremely useful: progressive rollouts such as a canary deployment depend on breaking metrics down by version.