

What is Distributed Tracing?
Definition
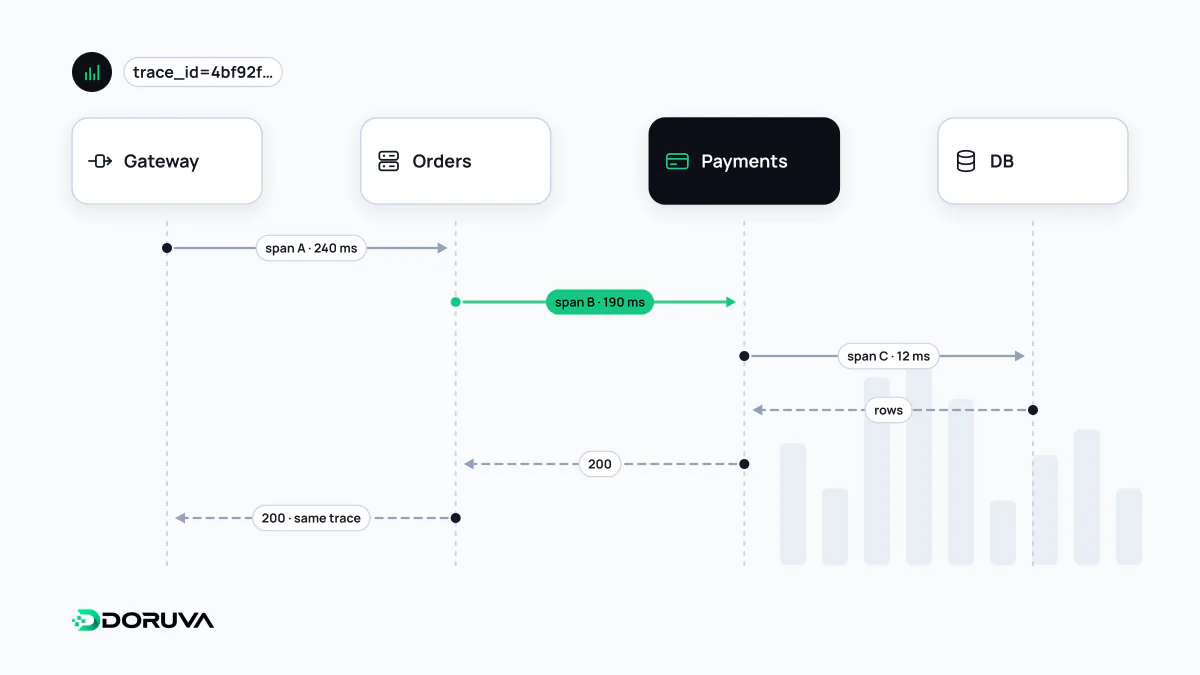
Distributed tracing is a technique for recording the end-to-end path of a single request as it passes through multiple services, databases and queues, together with the duration of each step. Each step is a span, and all spans of one request form a trace. A shared trace ID travels between services in standard headers such as W3C Trace Context, revealing where latency or errors originate.
Also known as: tracing, trace, span, request tracing, traceparent
When per-service logs stop being enough
Finding a slow request in a single application is manageable. Once a checkout passes through an API gateway, an order service, a payment service, an external bank and a queue, each service's logs only tell part of the story. Matching lines to requests and working out where 820 milliseconds went can take hours. Distributed tracing ties those pieces together with a shared ID and shows them on one timeline, which is why it is one of the core debugging tools for microservices.
Traces and spans
A trace is the full journey of one request. A span is one unit of work within it: an HTTP call, a database query, publishing a message. Each span has a start time, a duration, a status and a parent, so spans form a tree. Tracing tools draw that tree as a waterfall:
trace 4bf92f35…  POST /checkout                           820 ms
└─ api-gateway                                             815 ms
   ├─ order-service     SELECT orders                       38 ms
   ├─ payment-service   POST bank.example/charge           690 ms  ← bottleneck
   └─ order-service     publish payment.completed           12 ms
Attributes on spans, such as HTTP method, status code, database name or customer tier, make the data queryable: which span dominated the checkout requests that took longer than 500 ms in the last hour? It is the most direct way to break end-to-end latency into its parts.
Context propagation and the traceparent header
For a downstream service to join the same trace, the caller must pass the context along. Over HTTP that happens in an HTTP header. The W3C Trace Context specification, a W3C Recommendation since 2021, defines its format:
traceparent: 00-4bf92f3577b34da6a3ce929d0e0e4736-00f067aa0ba902b7-01
             │  │                                │                └ flags (01 = sampled)
             │  │                                └ parent span ID (16 hex)
             │  └ trace ID (32 hex)
             └ version
A companion tracestate header carries vendor-specific data. Because the format is standard, services written in different languages and instrumented with different tools can contribute to one trace. In asynchronous flows, the context is copied into the headers of a message placed on a message queue, so the consumer's work shows up in the same trace.
Sampling
Storing every span of every request is expensive on a busy system, so traces are sampled:
- Head-based sampling decides at the start of the request, for example keeping 5% of traces. It is cheap and simple but can miss the rare slow or failing request. The decision travels downstream in the
traceparentflags. - Tail-based sampling decides after the trace completes, keeping every trace with an error or above a duration threshold plus a fraction of normal ones. The data is more valuable, but all spans have to be buffered somewhere first.
Connecting traces to logs and metrics
Write the trace ID into every log line and you can jump from a span in the waterfall to the logs of that exact step. Drilling down from a latency spike on a dashboard to example traces relies on the same link, and together the three signals form the backbone of observability. In practice most teams instrument with OpenTelemetry: automatic instrumentation for HTTP servers, clients and database drivers produces most spans without code changes, and the data can be exported to open-source backends such as Jaeger or Zipkin or to a commercial platform.