

What is Canary Deployment?
Definition
Canary deployment is a release strategy that exposes a new version to a small share of traffic or users first, compares metrics such as error rate and latency against the existing version, and increases the share step by step. If the metrics cross predefined thresholds, the rollout stops and the canary is withdrawn, so a faulty release is caught in a small group before it reaches everyone.
Also known as: canary release, canarying, progressive rollout, incremental rollout
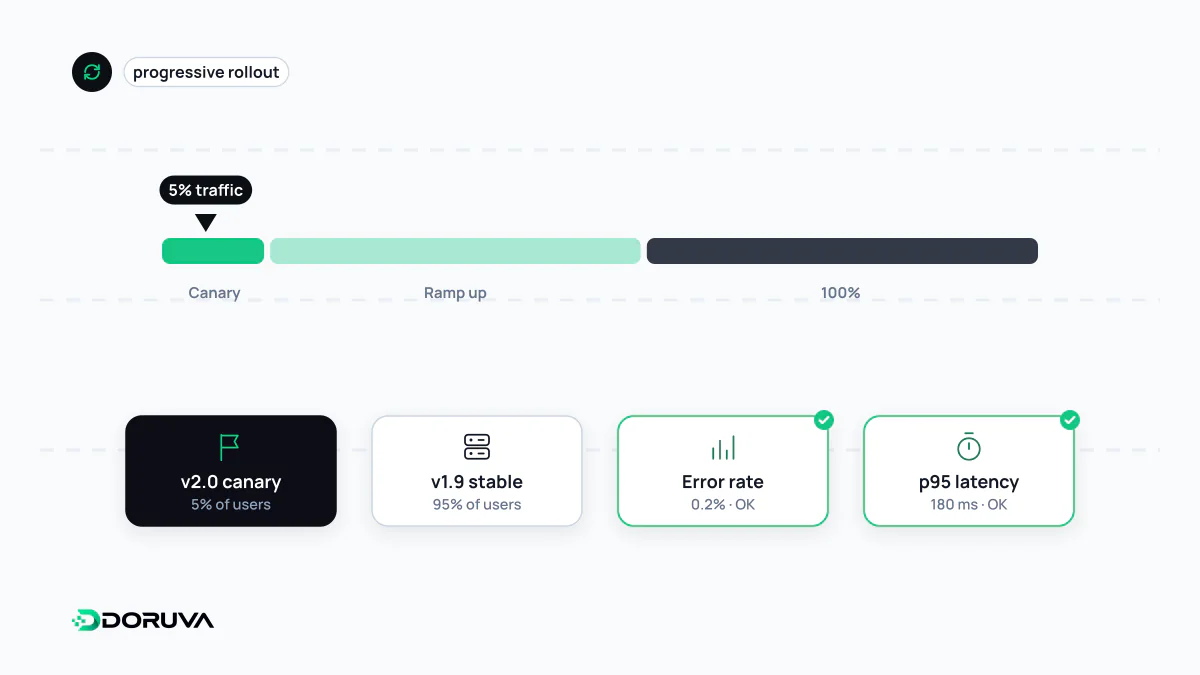
Small blast radius on purpose
Miners once carried canaries underground: the bird reacted to toxic gas before the people did, giving them an early warning. A software canary plays the same role. The new version goes to a small group first, and if something is wrong, the damage stays inside that group. However good your test suite is, it cannot reproduce the variety of real traffic. A canary lets you try a release under real conditions while capping how many people a bad build can hurt.
Google's SRE workbook describes canarying as a partial and time-limited deployment of a change, followed by its evaluation. The population that receives the change is the canary; the rest is the control. Every decision rests on comparing the two.
A stepped rollout plan
A canary plan is a series of steps, each followed by a wait and an evaluation:
| Step | Traffic on new version | Wait | What you check |
|---|---|---|---|
| 1 | 1% | 15 minutes | Crashes, 5xx rate, startup errors |
| 2 | 10% | 30 minutes | Error rate and p95 latency versus control |
| 3 | 50% | 1 hour | Resource usage, business metrics such as checkouts |
| 4 | 100% | — | Old version retired |
The numbers are illustrative. What matters is that each step collects enough traffic to make problems visible. On a service handling a few hundred requests a day, a 1% canary will not produce a meaningful signal no matter how long you wait.
Metric gates: promote or abort
The discipline of a canary is deciding the rules before the rollout starts. Typical gates ask:
- Is the canary worse than control? Compare error rate and latency against the control group over the same time window. Absolute thresholds are easily fooled by daily traffic patterns; a side-by-side comparison filters that noise out.
- Is it saturating resources? Unexpected growth in CPU, memory or connection pool usage often shows up before errors do.
- Are users still completing tasks? Sign-up, add-to-cart and checkout rates catch the broken button that technical metrics never notice.
None of this works unless every measurement can be broken down by version, so your observability stack has to tag telemetry with the release it came from. When a gate fails, the canary's weight drops to zero, which amounts to a small, fast rollback. Progressive delivery tools and service meshes can automate both the analysis and the abort.
Splitting traffic
The split usually happens in a load balancer, an ingress controller or a service mesh that supports weighted routing. Stickiness is the detail people miss: if a user sees the new version on one request and the old one on the next, the interface can behave inconsistently. Assigning users by a hash of their ID or a cookie keeps each person in the same group for the whole rollout. Mobile apps run canaries through staged rollouts in the app stores, where pulling a release back is much slower than on the server side.
How it differs from blue-green
| Blue-green | Canary | |
|---|---|---|
| Cutover | All traffic at once | Percentage by percentage |
| Users hit by a defect | Everyone, at the switch | Only the current canary group |
| Infrastructure | Two full environments | Weighted routing and per-version metrics |
| Rollout duration | Short | Longer, because of steps and waits |
They are not rivals. Many teams shift traffic gradually between blue-green environments and get both benefits. One limit applies to both: a canary reduces the risk in application code, but a schema change on a shared database affects every user from the moment it runs.