

What is Web Performance?
Definition
Web performance is how quickly a web page loads, how fast it responds to user input and how stable it stays while loading, and also the discipline of measuring and improving those qualities. It is shaped by server response time, network latency, file sizes and the amount of JavaScript the browser has to run. Google measures the user-facing side of it with the Core Web Vitals metrics.
Also known as: site speed, page speed, website performance, website speed
Speed is several numbers, not one
“The site is slow” usually bundles several different problems into one complaint. A page load can be split into four phases, each with its own bottlenecks:
- Network and server: DNS lookup, connection setup, the TLS handshake and the server sending its first byte, summarised by TTFB.
- Visible content: the first text and then the main element, usually a large image or headline, appearing on screen.
- Responsiveness: how quickly the screen reacts when someone taps a button or opens a menu.
- Stability: whether content jumps because an ad or image arrived late.
So “my page loads in three seconds” says little on its own. On which device, over which connection, measuring which moment?
Lab data and field data
Performance is measured in two ways. Lab measurement means a tool such as Lighthouse loads the page under controlled conditions with a fixed device and network profile. It is repeatable, which makes it ideal for debugging and for comparing before and after a change. Field data comes from real visitors' browsers, via the Chrome UX Report (CrUX) or a site's own real user monitoring. Field data shows what people actually experience, but not why.
Google's Core Web Vitals thresholds are defined on field data at the 75th percentile of page visits:
| Metric | What it captures | “Good” threshold |
|---|---|---|
| LCP | When the main content has loaded | 2.5 seconds or less |
| INP | Responsiveness to interactions | 200 milliseconds or less |
| CLS | Unexpected layout shifts | 0.1 or less |
Sites with a great Lighthouse score and poor field data are common. A developer's fast laptop on fibre says nothing about a visitor on a mid-range Android phone over a patchy mobile connection.
Common causes of slow pages
| Symptom | Frequent cause | Typical fix |
|---|---|---|
| Nothing happens for a while | Slow server, uncached pages, heavy database queries | Server-side caching, a CDN, query tuning |
| Hero image arrives late | Oversized image, resource discovered late | Image optimization, correct sizing, priority hints |
| Page is visible but sluggish to tap | Long JavaScript tasks on the main thread, third-party tags | Code splitting, removing scripts, breaking up work |
| Content jumps around | Images without dimensions, late-injected ads and banners | Set width and height, reserve space |
| Text files are bigger than needed | Compression switched off | HTTP compression (gzip, Brotli) |
What speed does for search and for revenue
Google states that Core Web Vitals are used by its ranking systems, and in the same documentation that good scores do not guarantee top rankings and that it will still show the most relevant content even when page experience is weak. Speed does not replace good content; it can separate pages of similar quality.
The more direct effect is on behaviour. A slow product page or a checkout step that lags after each tap makes visitors more likely to give up. The most convincing evidence for your own site comes from putting your performance data next to your conversion data, rather than from industry-wide statistics.
Holding on to the gains
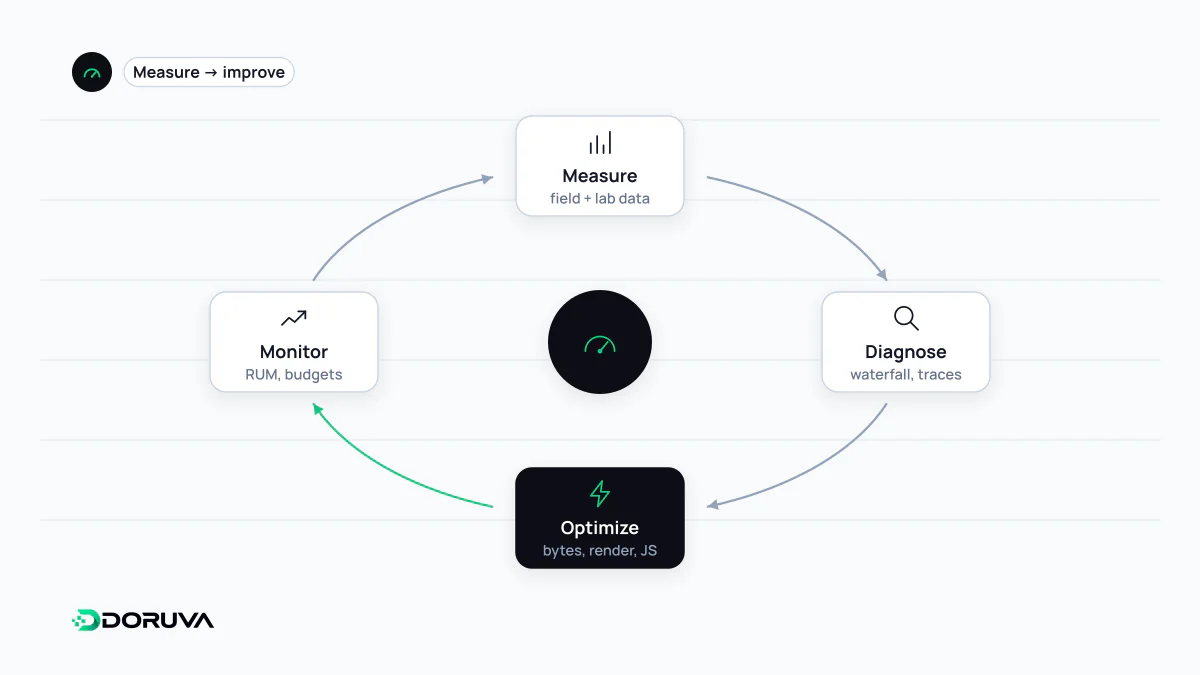
Performance is typically fixed once and then lost gradually: each new marketing tag, library or oversized banner adds a few hundred milliseconds. The defence is to write acceptable limits down as a performance budget, watch field data continuously, and measure changes before they ship. For the basic technical checks (compression, page weight, LCP issues) the SEO Checker is a quick place to start.