

What is TTFB (Time to First Byte)?
Definition
TTFB (Time to First Byte) is the time between the start of a navigation to a page and the moment the first byte of the server's response begins to arrive. It covers redirects, DNS lookup, connection and TLS setup, and the time the server needs to start responding. It is not a Core Web Vital; web.dev treats 0.8 seconds or less at the 75th percentile as good.
Also known as: Time to First Byte, first byte time, server response time
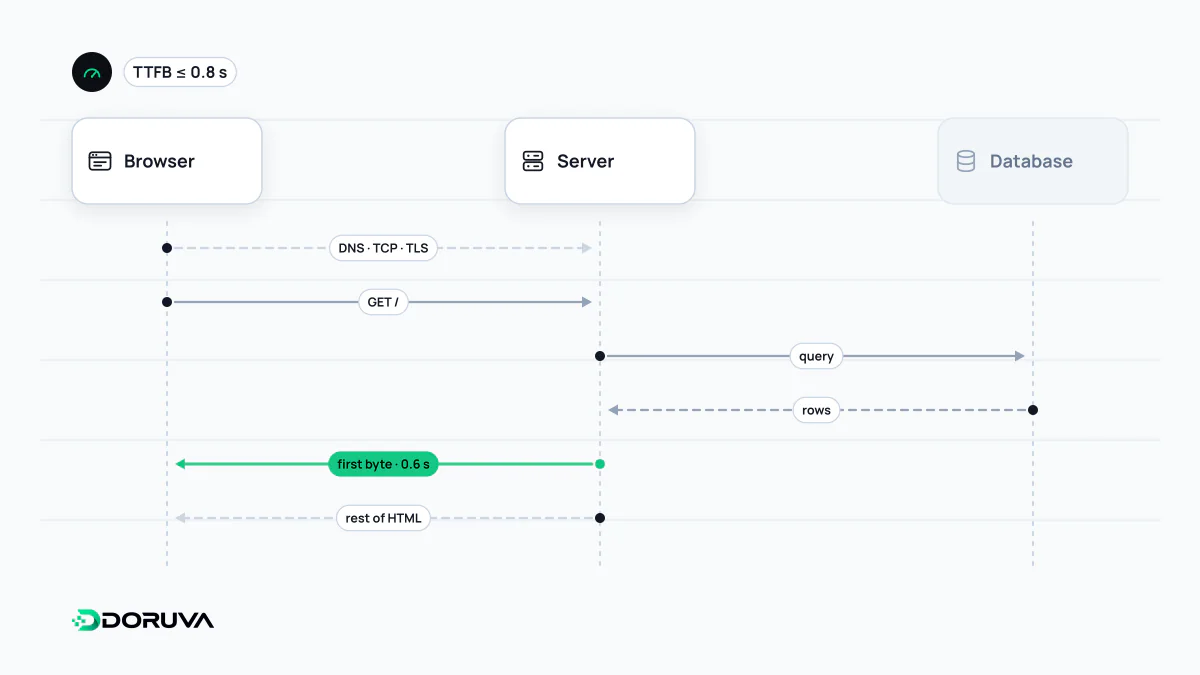
Everything that happens before byte one
Between a click and the first byte of HTML, the browser and server work through a series of steps, and TTFB is their sum:
- Redirects: every 301 or 302 hop on the way to the final URL.
- Service worker startup, if one controls the page.
- DNS resolution of the hostname.
- Connection setup: the TCP or QUIC handshake plus TLS negotiation for HTTPS.
- Server think time: routing, database queries, template rendering and any upstream API calls, until the response starts streaming back.
That is why "TTFB equals server speed" is only half true. A well-tuned backend can still post a poor TTFB if it sits on another continent or the URL passes through a redirect chain first.
Thresholds, and why they are only a guide
| Rating | TTFB at the 75th percentile |
|---|---|
| Good | ≤ 0.8 s |
| Needs improvement | 0.8–1.8 s |
| Poor | > 1.8 s |
TTFB is not a Core Web Vital, and web.dev explicitly says sites don't have to hit the "good" mark. It matters because it sits upstream of everything visible: nothing can paint before the first byte arrives, so every millisecond here is added to First Contentful Paint and to LCP. Context changes the picture, though. A server-rendered page may show a slightly higher TTFB because the HTML is generated before it is sent, yet the user receives real content straight away. A client-rendered app that ships an empty shell needs the fastest possible TTFB, because the meaningful work only starts once that shell arrives.
Measuring it properly
In real-user monitoring, TTFB comes from the Navigation Timing API:
const [nav] = performance.getEntriesByType("navigation");
// milliseconds from navigation start to the first response byte
console.log(nav.responseStart);
The web-vitals library wraps this as onTTFB(), and PageSpeed Insights shows Chrome's field data for TTFB where enough traffic exists. In the lab, the timing tab in Chrome DevTools' Network panel splits a request into DNS, connection and waiting time. To see inside the server's share, emit a Server-Timing header:
Server-Timing: db;dur=48, render;dur=112One subtlety: when a server sends a 103 Early Hints response, that interim response counts as the first byte. It can make TTFB look excellent while the final HTML is still slow, which explains many disagreements between tools.
Typical causes and fixes
- Uncached HTML. Rebuilding every page per request is expensive; even a short edge cache for HTML, set through Cache-Control, helps busy pages a lot.
- Distance. Each round trip adds latency. A CDN answers from edge locations close to the visitor.
- Slow backends. Unindexed queries, blocking calls to third-party services, cold starts on serverless platforms.
- Avoidable redirects. http to https to www to trailing slash. HSTS removes the HTTP-to-HTTPS hop on repeat visits.
Break the number down before optimizing; shaving the database when DNS and TLS dominate changes nothing. The metric definition lives on web.dev.