

What is User Journey?
Definition
A user journey is the full sequence of steps a person goes through with a brand, website or product to reach a goal, from noticing a need through research and purchase to later support. It is also called the customer journey. Teams usually visualize it as a journey map: a timeline showing the phases, the actions, thoughts and emotions in each phase, the touchpoints involved, and the opportunities to improve the experience.
Also known as: customer journey, user journey map, customer journey map, journey mapping
A story, not a funnel
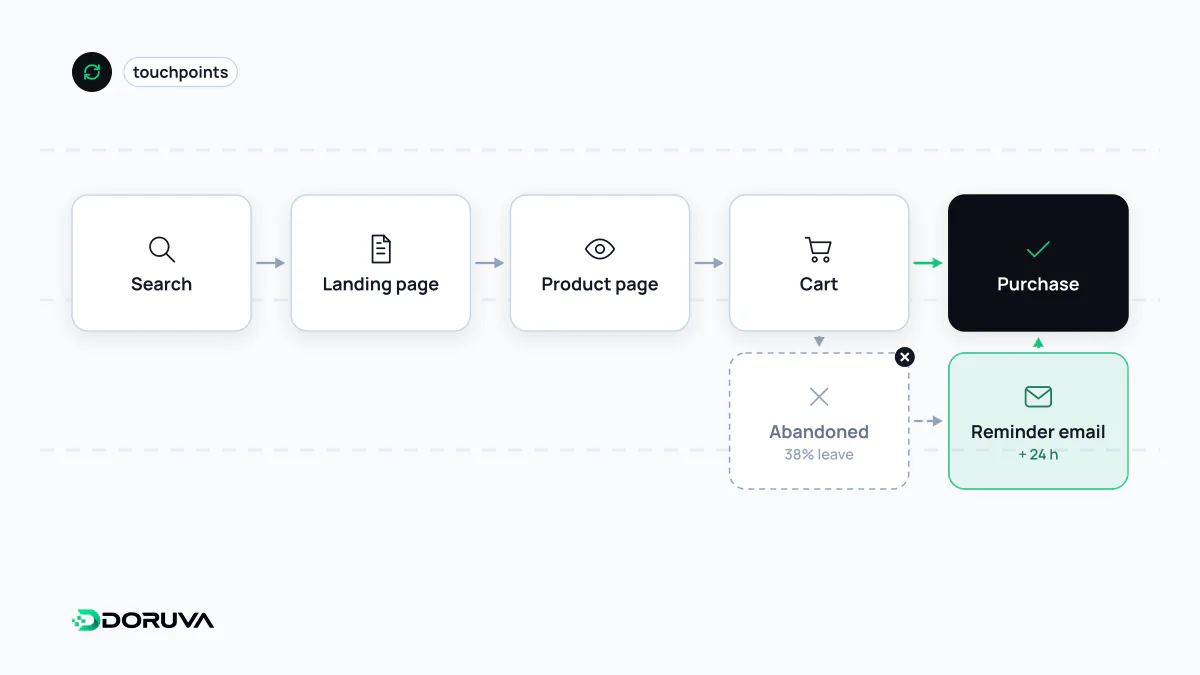
A conversion funnel counts a few steps from the site's point of view: product page, cart, checkout. A user journey is told from the person's point of view and includes everything that happens off your site. Someone notices a need, searches on Google or asks an AI assistant, opens three vendors in tabs, asks a colleague, comes back two days later, fills in a contact form and then waits for a reply. The funnel captures a few measurable frames of that story; the journey map tries to show the whole film.
“Customer journey” and “user journey” describe the same method. Marketing teams favor the first, product and UX teams the second. In B2B products, where the people using the software are often not the ones paying for it, “user” tends to be the more accurate word.
Anatomy of a journey map
- Actor: whose journey it is, usually a user persona. One map, one point of view.
- Scenario and expectations: what the person is trying to achieve, and under what circumstances.
- Phases: high-level stages such as discover, research, compare, decide, use and get support.
- Actions, mindsets and emotions: what they do in each phase, what questions they have, where they feel relief or frustration.
- Opportunities: concrete improvements with an owner, which are the reason the map exists.
Example: requesting a quote for a B2B service
| Phase | What the user does | Friction | Opportunity |
|---|---|---|---|
| Research | Searches for the service, opens three providers | All three pages sound identical | Show the process and deliverables concretely |
| Compare | Looks for case studies and a price range | No pricing information anywhere | Explain cost drivers and typical ranges |
| Decide | Fills in the contact form | Twelve fields, phone number required | Cut fields, make phone optional |
| Wait | Waits for a reply | No idea when anyone will respond | State the response time on the thank-you page and in the email |
The last row shows why maps are worth the effort. In analytics the form submission is the finish line; for the user it is the most uncertain moment of the whole journey.
Validating the journey with data
A map starts as a hypothesis. Qualitative sources such as interviews, usability tests and session recordings explain why people behave as they do. Quantitative sources show how often: landing pages, paths and exit points in web analytics, and event tracking for form-field abandonment, filter use or datasheet downloads. Analytics tells you that people drop off at a step, not why. Read both together, and revisit the map when the numbers move.
Where journey maps go wrong
- Mapping the happy path: charting the flow the team designed hides the detours real users take.
- One map for everyone: averaging people with different goals produces a journey nobody actually has.
- No owners: a map without assigned opportunities ends up as a workshop artifact on a wall.
- Mixing in back-office steps: the internal sales, operations and support processes behind the experience belong in a service blueprint, a separate method that builds on the journey map.