Technology
Client Reporting: Which Metrics to Show, and How to Present Them
A good client report presents a few metrics tied to the business goal, with comparisons and interpretation, and says what happened, why and what comes next. This guide covers metric layers, KPIs by service, report structure and how to present bad results.
By Mehmet ÇalışırPublished 10 min read

Contents
This guide is for account managers, project managers and agency owners. Many agencies spend hours on reports every month, only for the client to glance at the first page and ask, "So, is this good?" The problem is rarely a lack of data. It is that the data is not connected to the decisions the client has to make. Below you will find how to choose the right metrics, how to structure the report and how to present results, good or bad.
What is a client report, and why do most go unread?
A client report is a document that summarizes the work an agency did during a period and the effect of that work on the client's goals, in a way that makes the client's next decision easier. It is not a data dump; it is data that has been interpreted.
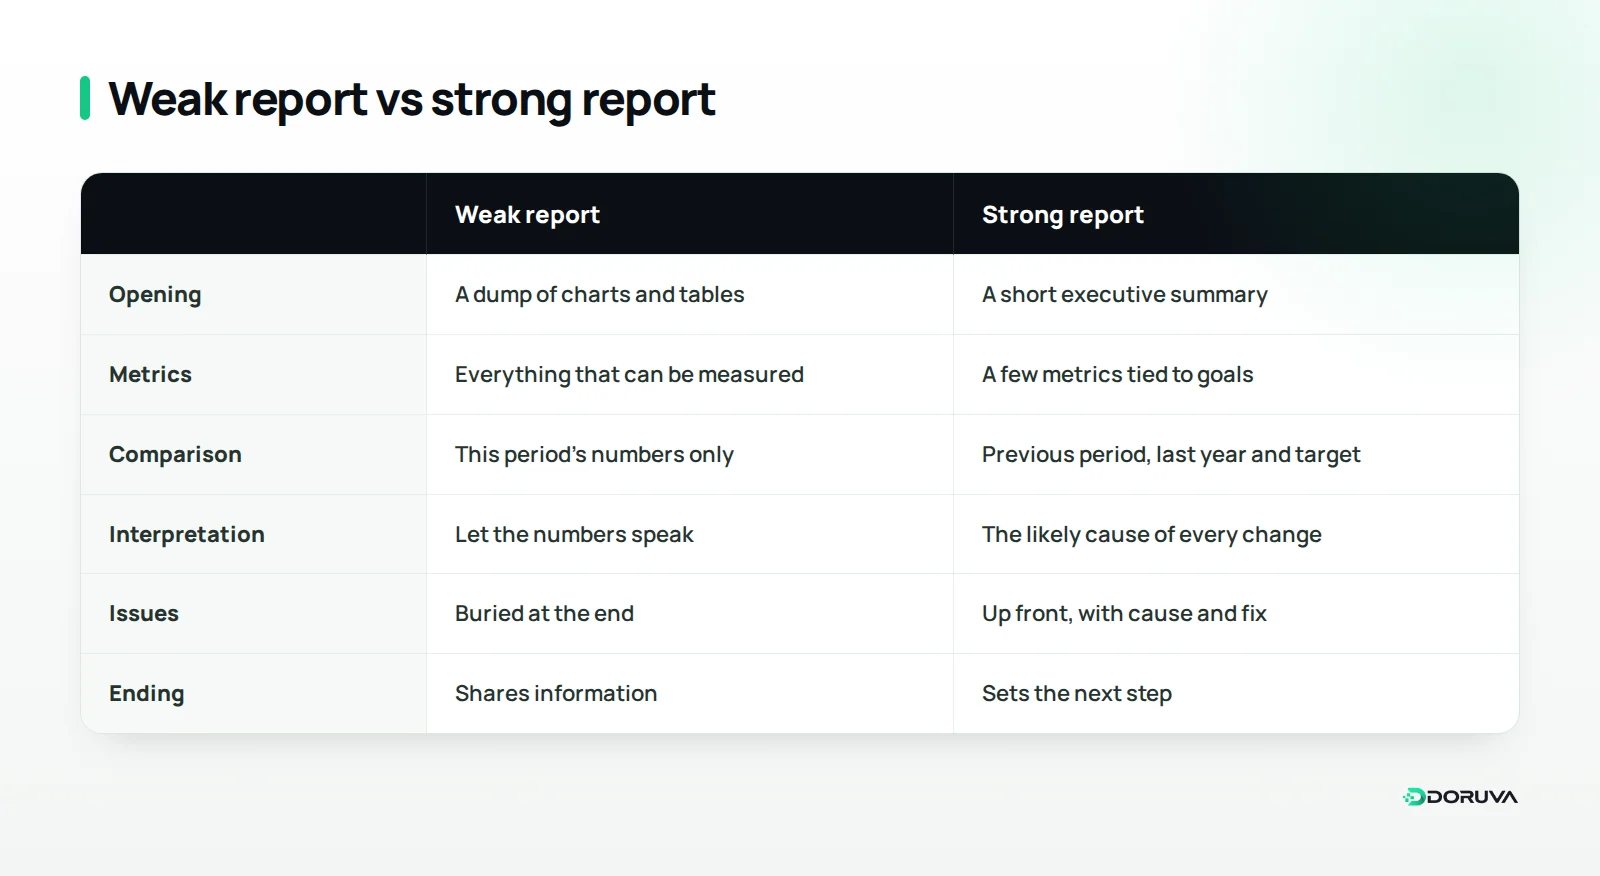
Unread reports usually fail for the same few reasons: pages of charts without a single concluding sentence, numbers with no context, metrics that cannot be linked to the client's business goal, and endings that never say what should happen next. If the client finishes a report without knowing what to think or do, the report has not done its job.
That is why knowing your reader matters. A business owner usually wants the overall picture in a few minutes, while a marketing specialist wants to drill into each channel. The way to serve both in one report is to keep a short summary separate from a detailed appendix, so the decision-maker can stop at page one and the specialist can still find the table they need.
One distinction matters here. A vanity metric is a measure that looks impressive but cannot be directly linked to a business outcome, such as follower count or total impressions. These metrics can appear in a report, but when they are presented as proof of success on their own, they slowly erode the client's trust.
Which metrics should a client report include?
Choose metrics using a layered structure that runs from business results down to activity. Each layer serves the one above it, and any metric that cannot be connected to a higher layer belongs in the appendix, not the body of the report.
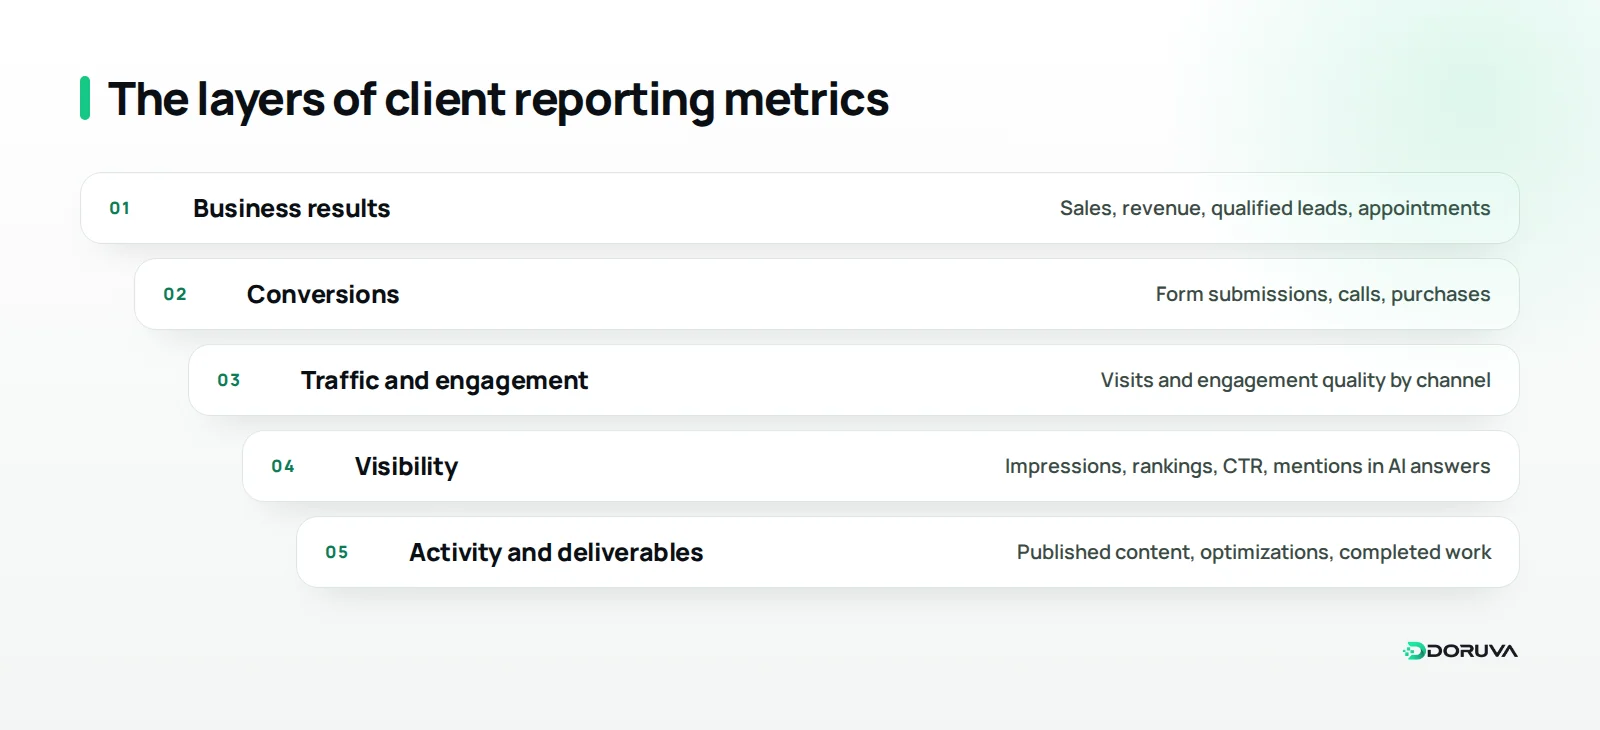
Business results
These are the numbers the client actually cares about: sales, revenue, qualified leads or booked appointments. They often live in the client's own sales records or CRM, which is why agreeing during onboarding on how you will access them matters so much.
Conversions
A conversion is a visitor completing a defined, valuable action, such as submitting a form, calling or buying. It is the layer closest to business results that the agency can measure directly, and it should sit at the center of most reports.
Traffic and engagement quality
This layer shows which channels visits come from and how engaged visitors are once they arrive. What matters is not total visits but the share coming from the channels and pages that actually drive conversions.
Visibility
Search impressions, rankings for priority pages, click-through rate (CTR) and brand mentions in AI-generated answers sit in this layer. Rising visibility is a good leading signal, but if it is not turning into conversions, the report needs to explain why.
Activity and deliverables
Published content, optimizations made and completed tasks belong here. Clients want to see what they are paying for, but the activity list should come near the end of the report, as context for the results, not at the top.
Which metrics matter most for each service?
Every service needs one primary metric and a few supporting metrics that explain it. The table below is a starting framework for the services agencies most often report on.
| Service | Primary metric | Supporting metrics | Watch out for |
|---|---|---|---|
| SEO | Conversions from organic search | Organic clicks, impressions, visibility of priority pages | Rankings alone are not a result; account for seasonality |
| Paid ads | Cost per conversion and conversion value | CTR, cost per click, spend distribution | Ad platforms and analytics tools may count conversions differently |
| Social media | Qualified visits and inquiries from social channels | Engagement, reach, saves and shares | Follower growth on its own is not a business result |
| Website | Conversion rate and form completion | Page speed, error logs, mobile usage | Assess the first weeks after launch separately |
| AI visibility | Brand mentions and citations for target questions | Visibility against competitors, accuracy of answers | Answers vary; track the same question set regularly |
Because AI visibility is still a fairly new reporting line, you need to explain the method as well as the numbers. State which questions you track, in which AI tools and how often; our article on how to measure AI visibility covers the methods in detail. For a baseline, our GEO checker shows how ready a site is for AI answers, and our AI visibility service covers ongoing work.
Add one caveat across channels, too: the same sale can be claimed by more than one channel's report. Marketing attribution is the method that decides how much credit each touchpoint gets for a conversion. Stating which attribution approach you use prevents confusing pictures such as "every channel is up, but sales are flat."
How should a good client report be structured?
A good report states the conclusion first, shows the evidence next and ends with the next step. Writing as if the client will read only the first page tends to produce the right structure on its own.
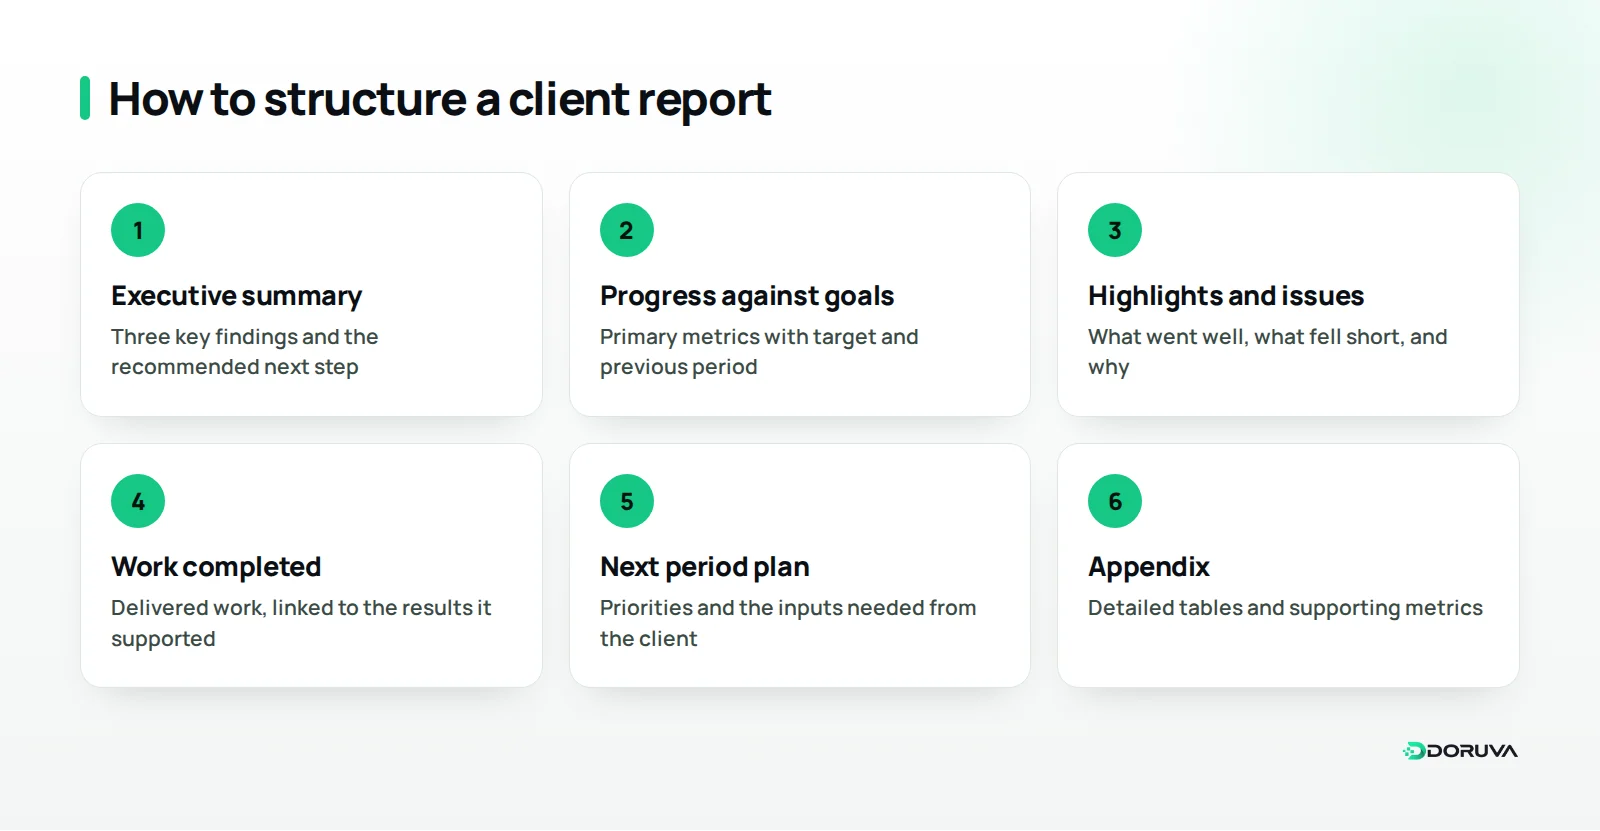
- Executive summary: the three most important findings of the period and the recommended next step, in a few sentences at most.
- Progress against goals: every agreed primary metric, shown with its target and the previous period.
- Highlights and issues: what went well, what fell short and the likely reasons.
- Work completed: a short list of what was delivered, linked to the results it supported.
- Plan for next period: priorities, expected impact and the approvals or inputs you need from the client.
- Appendix: detailed tables and supporting metrics at the very end, for readers who want to dig in.
Here is what an executive summary can look like: "Appointment requests from the website beat the target this month, and most of the growth came from the redesigned service pages. On the ads side, cost per conversion went up, and we are investigating why. For next month, we recommend using the two best-performing service pages as ad landing pages." Those three sentences tell the client everything they need to know; the rest of the report is the evidence behind them.
The "work completed" section is compiled from your team's task records. If your agency project management setup is in good shape, with every job logged against an owner and a status, this section takes minutes rather than hours.
How do you present numbers with context?
A number only means something when it is compared and interpreted. "We received 120 form submissions this month" does not say whether that is good or bad; compared with the target, the previous period and, where relevant, the same period last year, it becomes a story.
Follow these rules when presenting numbers:
- Use three comparisons: the previous period, the same period last year and the target. For seasonal businesses, such as an online store that peaks before the holidays, comparing only with last month can be misleading.
- Explain the change: a campaign, a site update, a change in tracking setup or a market-wide swing; state the likely cause and how confident you are.
- Keep data sources fixed: read each metric from the same source with the same definition every period. If the source changes, say so in the report.
- Make chart titles conclusions: write "Organic inquiries are running ahead of target" instead of "Organic traffic", so the reader does not have to interpret the chart.
- Give each chart one message: rather than squeezing five metrics into one chart, use a simple chart for each point.
- Pair percentages with absolute numbers: on a small base, a percentage change looks bigger than it is. Going from 2 to 4 form submissions a month is a 100% increase, but its business impact is limited; showing both figures side by side avoids both hype and needless alarm.
How often should you report, and in what format?
Reporting frequency depends on how fast the service changes and how often the client has to make decisions. That decision belongs in client onboarding, made together with the client, not improvised with the first report.
For most agencies, a three-tier rhythm works well:
- Weekly update: completed work, blockers and approvals needed from the client; a few lines in a message are enough.
- Monthly report: metrics, interpretation and next month's plan; the structure in this article applies mainly here.
- Quarterly review: a meeting to revisit strategy and goals, ideally with the decision-maker in the room.
Format deserves the same distinction. A live dashboard shows the data at any moment, a written report interprets it, and a meeting produces decisions. Replacing the report with a dashboard hands the job of interpretation to the client; using both together works best for most accounts.
Standardize the reporting process itself, too. A shared template across clients, fixed days for collecting data and sending the report, and a second person checking each report before it goes out all reduce errors and stop reporting from becoming a scramble on the last day of the month.
How do you report bad results?
Bad results should never be buried at the end of a report; state them plainly, with their causes and a plan to fix them. If a client learns about a problem from their own data instead of your report, what you lose is far bigger than one month's performance.
When reporting a problem, answer four questions: what happened, why you think it happened, what you have done so far and what you will do next. Say a dental clinic's form inquiries dropped after a site update because the form stopped working on mobile devices. Reporting the drop, the cause you found, the date of the fix and the check you added to prevent it happening again protects the client's trust.
If the cause sits outside the agency, for example late approvals on the client side or a budget change, describe it in neutral language that shows the impact rather than assigning blame, and say clearly what you need from the client to resolve it.
Some "bad" results are really expectation problems. For work whose impact builds over time, such as SEO, having discussed during onboarding what the first months will look like prevents surprises in the report. If expectations were set correctly at the start, the report only has to show where you are against the plan.
Summary and next steps
A good client report works with a small set of metrics tied to business goals. It states the conclusion up front, presents numbers with comparisons and interpretation, does not hide problems and ends with a next step. In your next report, simply adding an executive summary and turning every chart title into a conclusion will make a noticeable difference.
For the delivery side of the report, the Reporting screen in Doruva One can help: its Deliveries tab shows work by status, such as On Time, Late, Open and Overdue, and Approaching, and you can choose a date range and export the data as CSV. If you would like to talk through your team's reporting and work tracking, get in touch with us.
Frequently Asked Questions
How many metrics should a client report include?
One primary metric per service, plus a few supporting metrics that explain it, is usually enough. What matters is not the count but whether each metric connects to the client's business goal.
How often should agencies send client reports?
For most agency services, a short weekly update, a monthly report and a quarterly review meeting make a balanced rhythm. Agree on the cadence with the client during onboarding.
What is a vanity metric?
A measure that looks impressive but cannot be directly linked to a business outcome, such as follower count or total impressions. It can appear in a report, but should not be presented as proof of success on its own.
Why don't analytics numbers match the ad platform?
Platforms can define conversions differently and use different attribution approaches and time windows. Stating which source the report relies on, and using the same source every period, keeps the gap manageable.
Can a live dashboard replace a written report?
No. A dashboard shows the data, while a report interprets it and recommends a next step. For most clients, using both together works best.