

What is Speed Index?
Definition
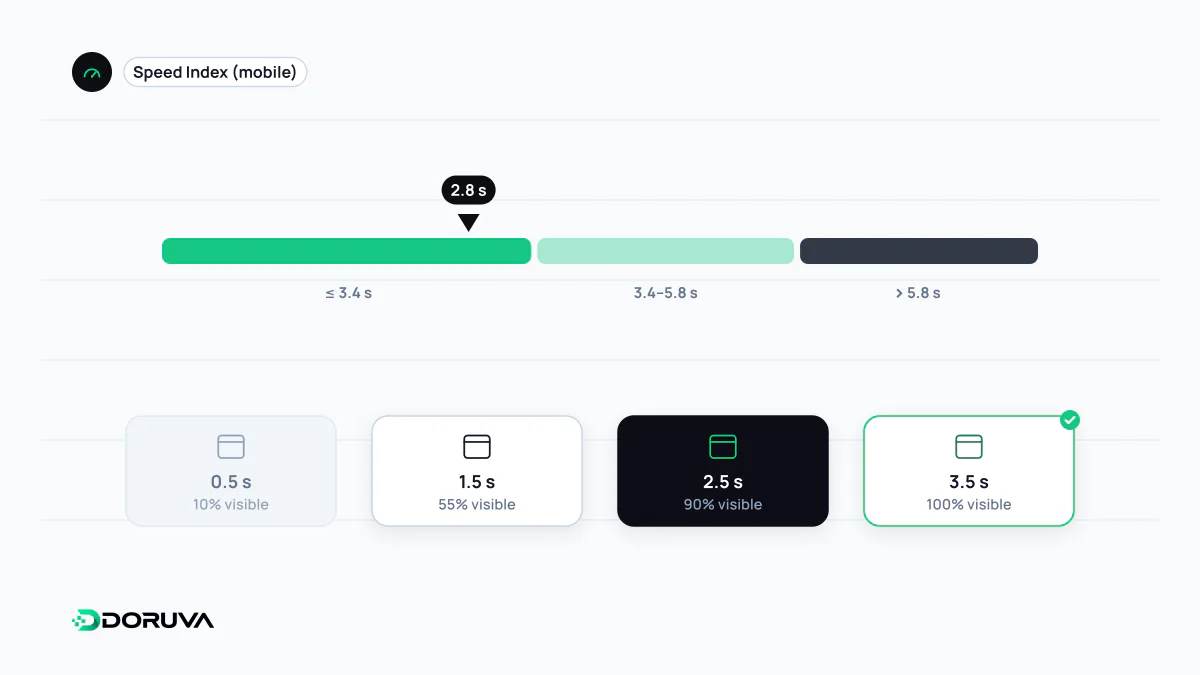
Speed Index is a lab metric that measures how quickly the visible content of a page is displayed during load. The load is recorded as video, visual progress between frames is calculated, and the result is expressed as a single value in seconds; a lower value means the screen filled in earlier. It accounts for 10% of the Lighthouse performance score.
Also known as: SI, visual load speed
Measuring the whole curve, not one moment
Metrics such as FCP and LCP pin down a single moment in the load. Speed Index summarises the entire process. Picture two pages that both finish rendering at five seconds: one is 80% complete after the first second, the other shows nothing for four seconds and then pops in. Their end times match, but users experience them very differently, and Speed Index reflects that difference.
Conceptually, it accumulates how much of the viewport is still visually incomplete over time. The earlier the screen fills, the smaller that area and the lower the score. The metric originated at WebPageTest; Lighthouse implements the same idea through a Node.js module called Speedline.
How Lighthouse scores it
Lighthouse records a video of the page loading, computes visual progression between frames and converts the result to seconds. Thresholds depend on the device profile:
| Profile | Fast | Moderate | Slow |
|---|---|---|---|
| Mobile | 0–3.4 s | 3.4–5.8 s | > 5.8 s |
| Desktop | 0–1.3 s | 1.3–2.3 s | > 2.3 s |
Speed Index contributes 10% of the performance score. Because it depends on comparing rendered frames, it exists only in lab and synthetic monitoring tools. Browsers do not report it from real visits, and it is not part of Chrome's field data.
Reading it with care
- It is viewport-bound. Only the initial screen counts, so mobile and desktop values are not directly comparable.
- Motion distorts it. Auto-rotating carousels, animated hero sections or autoplaying video keep the frame "changing" and can inflate the value.
- It is not a goal on its own. The Lighthouse docs suggest focusing on the overall score and diagnostics unless you have a specific reason to chase one metric. A page with a decent Speed Index but a slow LCP still shows its main content late.
What moves the number
Lighthouse lists three diagnostics with the biggest effect: minimising main-thread work, reducing JavaScript execution time, and keeping text visible while web fonts load. Beyond those, prioritising the styles and images needed for the above-the-fold area helps the first screen render as a whole rather than piece by piece. When first contentful paint moves earlier, Speed Index usually follows.